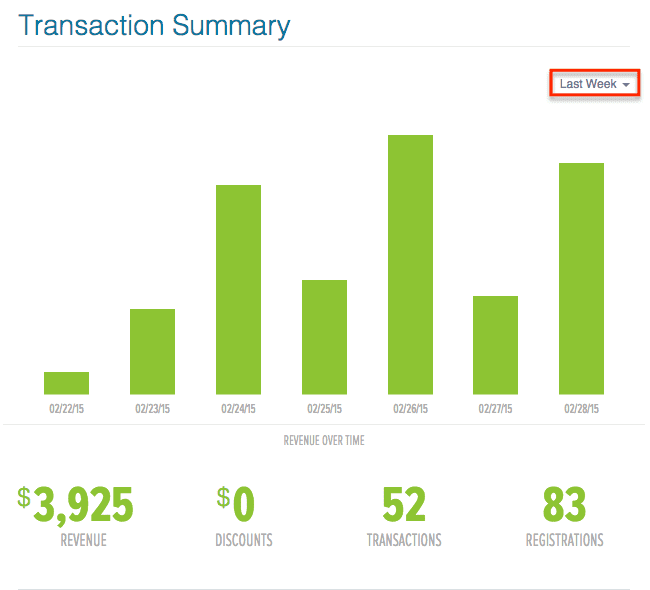
With our recent release, DigitalChalk has given you a new way to look at your e-commerce transactions. Administrators will now see a ‘Transactions’ section under their administration tab that will allow them to see registrations as a graph. You can select any specific time period and view the graph for that given time frame. This graph allows you to see the total revenue, discounts used, number of transactions, and the number of registrations.
Another feature you might have noticed since the release is a report with a new name. You may have been used to seeing a ‘Payout’ report option – now you will see an ‘Account Summary’ report. This report has the same information as the old ‘Payout’ report, just a new name. In this report you will find information on the registration date, offering name, price of the offering, any discounts used, registration fee, credit card payment, credit card processing fee, and account balance information.
What do you think of the new transactions page? Let us know in the comments below!

